COVID-19 Statistics Broken Down


With over 2.1 billion mentions in the media, there has been a worldwide panic due to the recent COVID-19, or Coronavirus, outbreak. Along with that, there has been a significant amount of uncertain details and statistics released to the public regarding the pandemic. This has led many to speculate whether the information we receive is true or false.
The main concern that rises for the population regarding the virus is the infection rates, then recovery and mortality rates. According to a study of 44,672 confirmed cases in Mainland China and 16,925 cases in Italy from the China Centre for Disease Control and Prevention, Statista, those aged 60+ are most at risk for infection. Looking at the graph, it is obvious that those among
he younger age groups have a very low risk of contracting the virus, but should still be wary.
Following infection rates of the disease, there is the mortality rate. According to John Hopkins University, infection and fatality rates vary by country. Some of these factors include the quality of healthcare and the average age of the population, but despite the variation among all countries, the percentage of cases that have died does not exceed 11%.
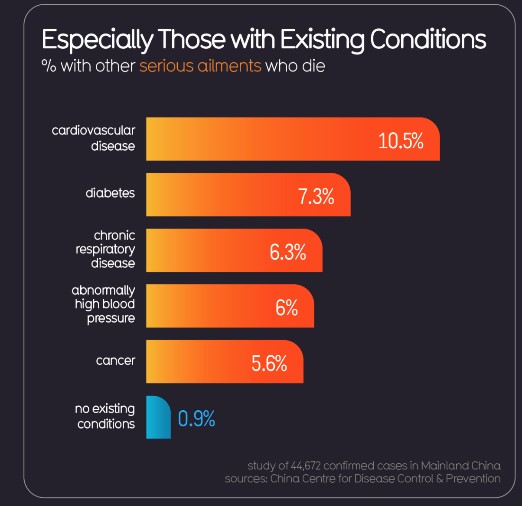
Mortality rates also increase for those with existing medical conditions, such as cardiovascular disease, diabetes, chronic respiratory disease, abnormally high blood pressure, and cancer. With no preexisting conditions, there is a 0.9% chance of death after being infected.
Every hour, this information is updated, but as of late, the following statistics provide general ideas and rough estimates of what to expect regarding the pandemic.

by Ryan Yi